
For the past couple of months, my content streams have been inundated with marketing predictions for 2017. One thing that struck me? How so many of these articles had a common prediction: the undeniably growing importance of visual marketing.
Forbes, Business 2 Community, Convince & Convert, TNW, and Online Marketing Institute have all urged their readers to embrace visual content in 2017. And it isn’t surprising. Images are easier to consume quickly than pure text. They’re also more likely to grab your attention.
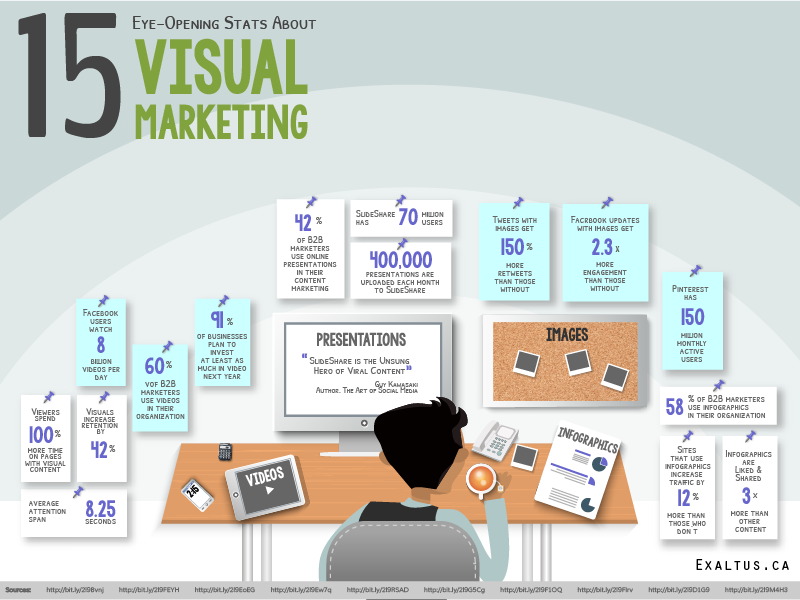
In this infographic and below, uncover fifteen eye-popping stats about visual storytelling that will convince you to invest in visual content this year.

1. The average attention span is about 8.25 seconds long. (Source: Statistic Brain)
2. Viewers spend 100% more time on pages with visual content. (Source: Prezi)
3. Visuals increase retention by 42%. (Source: Prezi)
The average attention span is about 8.25 seconds long. Click To Tweet Viewers spend 100% more time on pages with visual content. Click To Tweet Visuals increase retention by 42%. Click To Tweet
Videos
4. Facebook users watch 8 billion videos per day. (Source: The Verge)
5. 60% of B2B marketers use videos in their organization. (Source: Content Marketing Institute)
6. In 2015, 91% of businesses said they planned to increase or maintain their spending on video in 2016. (Source: Wyzowl)
Facebook users watch 8 billion videos per day Click To Tweet 60% of B2B marketers use videos in their organization Click To Tweet
Presentations
7. 42% B2B marketers use online presentations in their content marketing. (Source: Content Marketing Institute)
8. 400,000 presentations are uploaded each month. (Source: Linkedin)
9. Slideshare has 70 million users. (Source: Slideshare)
42% B2B marketers use online presentations in their content marketing Click To Tweet 400,000 presentations are uploaded each month Click To Tweet Slideshare has 70 million users Click To Tweet
Images
10. Tweets with images receive 150% more retweets than tweets without images. (Source: Buffer App)
11. Facebook updates with images had an amazing 2.3x more engagement than those without. (Source: Buzz Sumo)
12. Pinterest has reached 150 million monthly active users (Source: Forbes)
Tweets with images receive 150% more retweets than tweets without images Click To Tweet Facebook updates with images had an amazing 2.3x more engagement than those without Click To Tweet Pinterest has reached 150 million monthly active users Click To Tweet
Infographics
13. 58% of B2B marketers use infographics in their organization (Source: Content Marketing Institute)
14. Marketers who use infographics increase their traffic 12% more (on average) than those who don’t. (Source: Hubspot)
15. Infographics are Liked & Shared 3x more than other content. (Source: Mass Planner)
58% of B2B marketers use infographics in their organization Click To Tweet Marketers who use infographics increase traffic 12% more than those who don’t Click To Tweet Infographics are Liked & Shared 3x more than other content Click To Tweet
Over to You
What are your plans for integrating visuals in your marketing strategy? Are you ready to up your game? I’d love to hear from you in the comments.
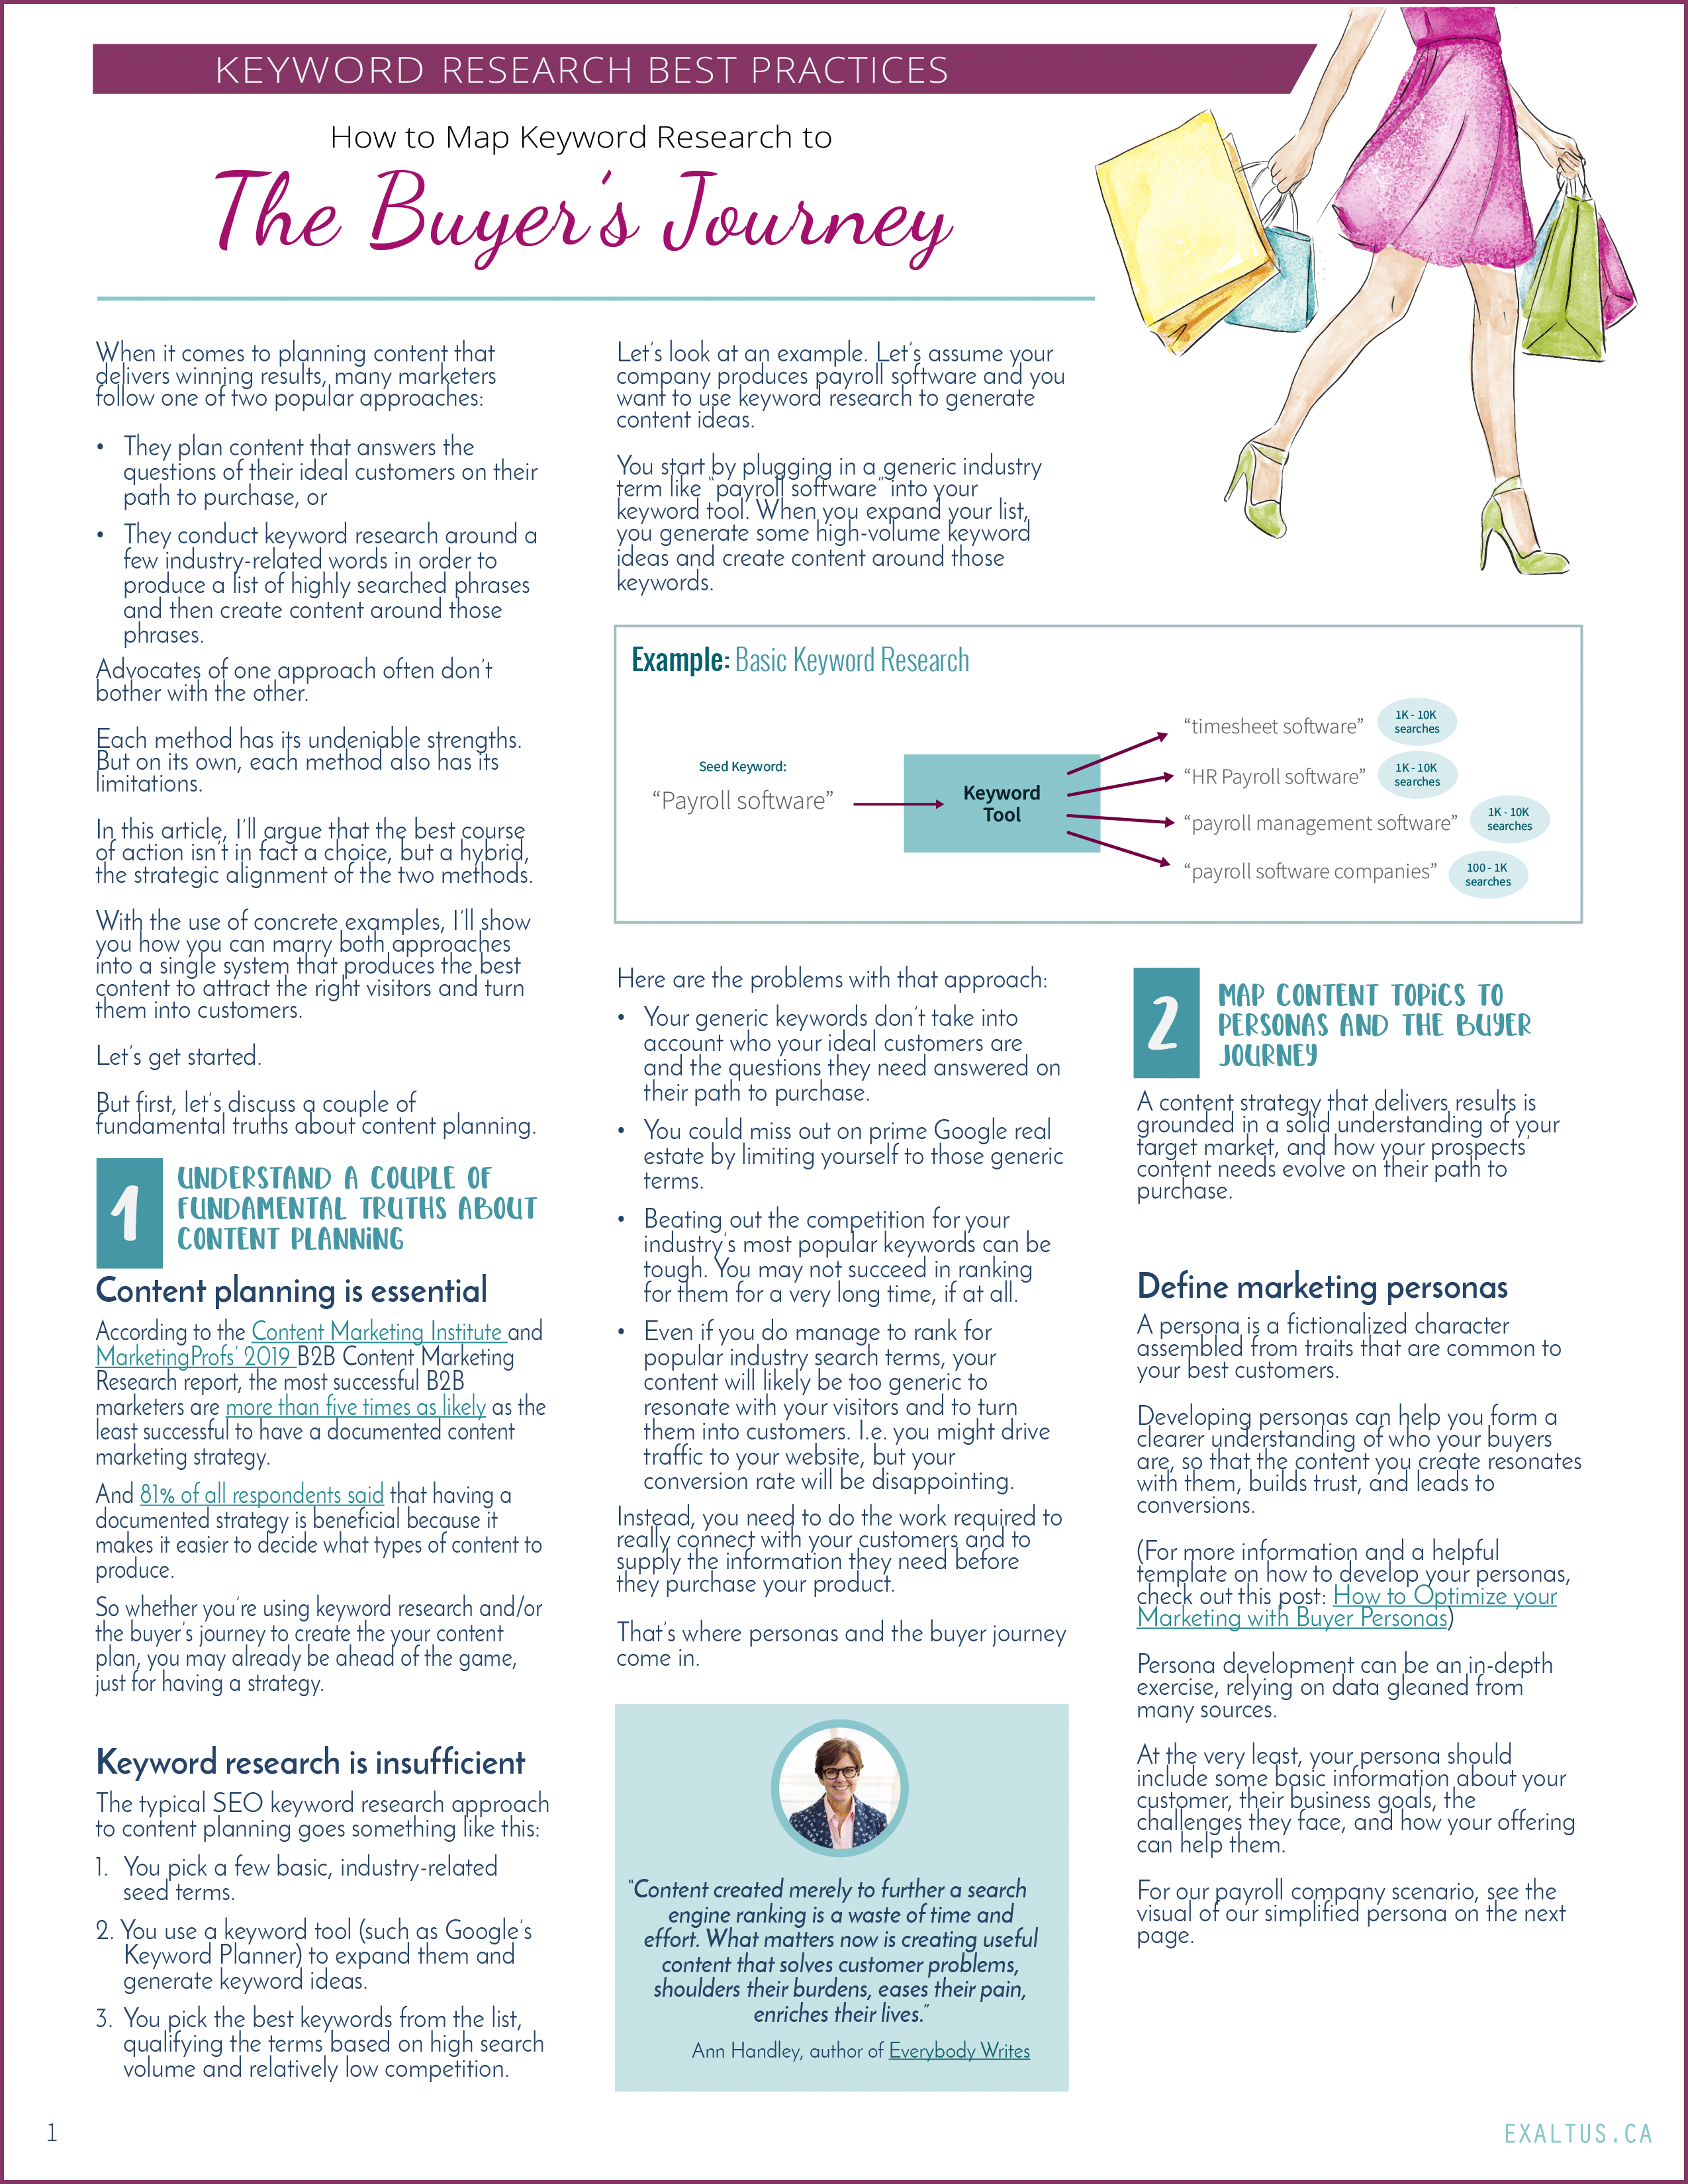
And if you’re looking for help with your content marketing, check out our content marketing best practices for small business, find out about our Blog in a Box plan, or contact Exaltus today!


Leave A Comment